Example L1 Continuous
response model
Bland and Altman (1986) report on a study to compare the standard Wright peak flow meter with the (then) new Mini Wright peak flow meter. The data that accompany this study (pefr.dat) contain the repeated measurements of peak expiratory flow rate (PEFR) obtained from a sample of 17 individuals. These subjects had their PFER measured twice using the new Mini Wright peak flow meter and twice using the Standard Wright peak flow meter. To avoid instrument effects being confounded with prior experience effects, the instruments were used in random order.
Reference
Bland, J. M., and Altman, D., G., (1986), Statistical methods for assessing agreement between two methods of clinical measurement, Lancet, 1, 307-310.
Data description
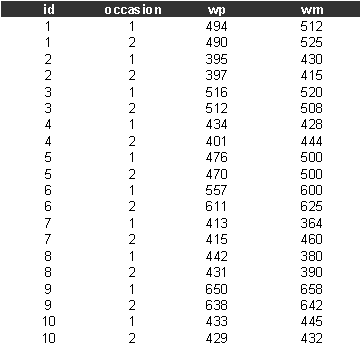
Number of observations (rows): 34
Number of variables (columns): 4
Variable description:
id= person identifier
occasion=occasion {1,2}
wp=Standard Wright meter PEFR
wm=Mini Wright meter PEFR
The first few lines of pefr.dat look like
Sabre commands
out pefr.log
trace pefr.trace
data id occasion wp wm
read pefr.dat
case id
yvar wm
family g
constant cons
lfit cons
dis m
dis e
mass 64
scale 110
fit cons
dis m
dis e
stop
Sabre log file
<S> trace pefr.trace
<S> data id occasion wp wm
<S> read pefr.dat
34
observations in dataset
<S> case id
<S> yvar wm
<S> family g
<S> constant cons
<S> lfit cons
Iteration Log. lik. Difference
__________________________________________
1 -207.71303
<S> dis m
X-vars Y-var
______________________________
cons wm
Univariate
model
Standard linear
Number of
observations = 34
X-var df =
1
Log likelihood
= -207.71303 on
33 residual degrees of freedom
<S> dis e
Parameter Estimate Std. Err.
___________________________________________________
cons 453.91 18.954
sigma 110.52
<S> mass 64
<S> scale 110
<S> fit cons
Initial
Homogeneous Fit:
Iteration Log. lik. Difference
__________________________________________
1 -207.71303
Iteration Log. lik. Step End-points Orthogonality
length 0 1
criterion
________________________________________________________________________
1 -206.22336 1.0000 fixed
fixed orthogonal
2 -205.97710 1.0000 fixed
fixed orthogonal
3 -205.73103 1.0000 fixed
fixed orthogonal
4 -205.48502 1.0000 fixed
fixed orthogonal
5 -205.23897 1.0000 fixed
fixed orthogonal
6 -204.99279 1.0000 fixed
fixed orthogonal
7 -204.74639 1.0000 fixed
fixed orthogonal
8 -204.49970 1.0000 fixed
fixed orthogonal
9 -204.25266 1.0000 fixed
fixed orthogonal
10 -204.00524 1.0000 fixed
fixed orthogonal
11 -203.75742 1.0000 fixed
fixed orthogonal
12 -203.50919 1.0000 fixed
fixed orthogonal
13 -203.26056 1.0000 fixed
fixed orthogonal
14 -203.01158 1.0000 fixed
fixed orthogonal
15 -202.76232 1.0000 fixed
fixed orthogonal
16 -202.51287 1.0000 fixed
fixed orthogonal
17 -202.26335 1.0000 fixed
fixed orthogonal
18 -202.01391 1.0000 fixed
fixed orthogonal
19 -201.76474 1.0000 fixed
fixed orthogonal
20 -197.43520 1.0000 fixed
fixed orthogonal
21 -194.32273 1.0000 fixed
fixed orthogonal
22 -192.79269 1.0000 fixed
fixed orthogonal
23 -184.54051 1.0000 fixed
fixed 0.10893E-01
24 -184.40094 1.0000 fixed
fixed orthogonal
25 -183.89355 1.0000 fixed
fixed 0.37130E-01
26 -183.40135 0.5000 fixed
fixed 0.45536E-01
27 -183.39902 1.0000 fixed
fixed 0.43827E-01
28 -183.39902 1.0000 fixed
fixed
<S> dis m
X-vars Y-var Case-var
________________________________________________
cons wm id
Univariate
model
Standard linear
Gaussian random
effects
Number of
observations = 34
Number of
cases = 17
X-var df =
1
Sigma df =
1
Scale df =
1
Log likelihood
= -183.39902 on
31 residual degrees of freedom
<S> dis e
Parameter Estimate Std. Err.
___________________________________________________
cons 453.24 5.8776
sigma 18.558 2.6582
scale 112.23 4.4993
<S> stop