Exercise 3LC4. Poisson model, skin cancer deaths (78 regions in 9 nations)
This exercise uses the Langford et al (1998) data from the Atlas of Cancer Mortality in the European Economic Community (Smans et al, 1992). Data were collected on male malignant melanoma deaths over the period 1975 to 1981 for the UK, Ireland, Italy, Germany, the Netherlands and for 1971-1980 for other EEC countries. Interest focuses on establishing the role of ultraviolet (uv) light exposure to malignant melanoma deaths. The data set (deaths.dat) contains the number of deaths by year in county i (level 1) within region j (level 2), within nation k (level 3). The same data were used by Rabe-Hesketh and Skrondal (2005, exercises 6.4, 7.5).
References
Langford, I.H., Bentham, G., McDonald, A., (1998) Multilevel modelling of geographically aggregated health data: a case study on malignant melanoma mortality and UV exposure in the European Community, Statistics in Medicine, 17, pp 41-58.
Rabe-Hesketh, S., and Skrondal, A., (2005), Multilevel and Longitudinal Modelling using Stata, Stata Press, Stata Corp, College Station, Texas.
Smans, M., Muir, C.S., Boyle, P., (1992), Atlas of Cancer Mortality in the European Economic Community, Lyon, France: IARC Scientific Publications.
Data
description
Number of
observations = 354
Number of
level-2 cases (‘region’ = region identifier (EEC level-I areas)) = 78
Number of
level-3 cases (‘nation’ = nation identifier) = 9
The variables are:
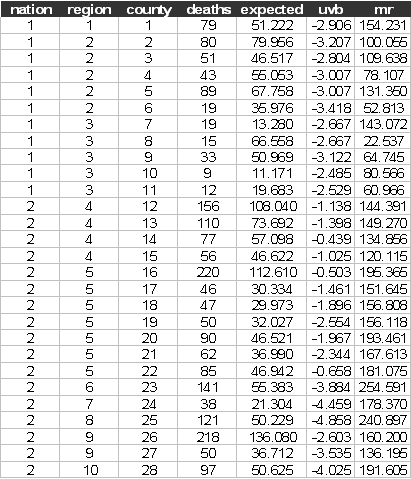
nation = nation identifier
region = region
identifier
county = county identifier
deaths = number of male deaths due to malignant melanoma (skin cancer) during
1971-1980
expected = number of expected deaths
uvb = measure of the UVB dose reaching the earth's surface in each county and centered around its mean
mr = mortality rate
The first few lines of deaths.dat look like:

Suggested
exercise:
1. Estimate a Poisson model (without random effects) for the number of deaths (deaths) with the covariate uv. Use log expected deaths as an offset.
You will need accurate arithmetic for the following questions.
2. Allow for the level-2 region random effect (region), use mass 96. Is this random effect significant?
3. Re-estimate the model with the level-2 random effect (region) and with nation as a level-3 random effect (nation) level 3. Use mass 96 for both levels. Are both these random effects significant?
4. How did your results change when you allowed for region-level (level 2) and then nation-level (level 3) effects?