Exercise C2, linear
model
Garner and Raudenbush (1991) and Raudenbush and Bryk (2002) studied the role of school and neighbourhood effects on educational attainment. The data set they used (neighbourhood.dat) was for young people who left school between 1984 and 1986 from one Scottish Educational uthority. The same data were used by Rabe-Hesketh and Skrondal (2005, exercise 2.2).
Data description
Number of observations (rows): 2310
Number of variables (columns): 12
Variables:
neighid=respondentís neighbourhood identifier
schid= respondentís schools identifier
attain=respondentís combined end of school educational attainment as measured by grades from various exams
p7vrq=respondentís verbal reasoning quotient as measured by a test at age 11-12 in primary school
p7read=respondentís reading test score as measured by a test at age 11-12 in primary school
dadocc=respondentís fatherís occupation
dadunemp= 1 if respondentís father unemployed, 0 otherwise
daded=1 if respondentís father was in full time education after age 15, 0 otherwise
momed=1 if respondentís mother was in full time education after age 15, 0 otherwise
male=1 if respondent is male, 0 otherwise
deprive= index of social deprivation for the local community in which the respondent lived
dummy=1 to 4; representing
collections of the schools or neighbourhoods
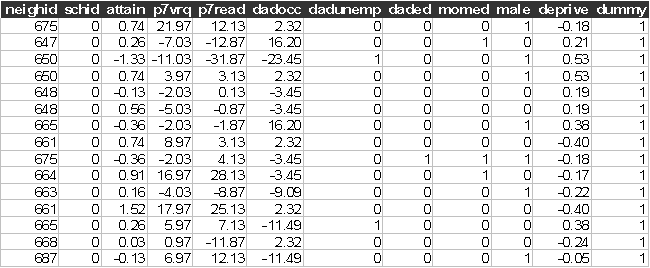
The first few lines of the data look like:

We can use both the school identifier (schid=0,1,2,Ö,20) and the neighbourhood identifier (neighid) as alternative random effects in this data set.
Start Sabre and specify transcript file:
out neighborhood.log
data neighid
schid attain p7vrq p7read dadocc
dadunemp daded momed male &
†††† deprive dummy
read neighborhood.dat
Suggested exercise:
(1) Estimate a linear model on attainment (attain) without covariates
(2) Allow for the school random effect (schid), use mass 64. Is this random effect significant?
(3) Add the observed student specific effects, with the starting values sigma 0.7, scale 0.1. How does the magnitude of the school random effect change?
(4) Add the neigbhourhood effect (deprive), with the starting values, sigma 0.7, scale 0.1 How does the magnitude of the school random effect change?
A data set sorted by the neighbourhood identifier (neighid); has been made available for you, this data set is called neighbourhood2.dat. To analyse this new data set type:
data neighid
schid attain p7vrq p7read dadocc
dadunemp daded momed male &
†††† deprive dummy
read neighborhood2.dat
(6) Re-estimate the constant only model allowing for neighbourhood random effect (neighid), use mass 64. Is there a significant neighd random effect?
(7) Add the student specific effects, how does the magnitude of the neighid random effect change?
(8) Add observed neighbourhood effect deprive to the model, how does the magnitude of the neighid random effect change?
(9) What do the results of using either the schid or the neighid random effects tell you about what effects are needed in the modelling of attainment with this data set?
(10) What do the two sets of results show/suggest?
References
Garner, C. L., and Raudenbush, S. W., (1991), Neighbourhood effects on educational attainment: A multilevel analysis of the influence of pupil ability, family, school and neighbourhood, Sociology of education, 64, 252-262
Raudenbush, S. W., and Bryk, A. S., (2002), Hierarchical
Linear Models, Sage,
Rabe-Hesketh, S., and Skrondal, A., (2005), Multilevel and Longitudinal Modelling using Stata, Stata Press, Stata Corp, College Station, Texas