Exercise C4, ordered response model
Johnson and Albert (1999) analysed data on the grading of the same essay by five experts. Essays were graded on a scale of 1 to 10 with 10 being excellent. In this exercise we use the subset of the data limited to the grades from graders 1 to 5 on 198 essays (essays_ordered.dat). The same data were used by Rabe-Hesketh and Skrondal (2005, exercise 5.4).
Data description
Number of observations (rows): 990
Number of variables (columns): 17
Variables:
essay= essay identifier (1,2,…,198}
grader= grader identifier {1,2,3,4,5}
grade=essay grade {1,2,…,10}
rating= essay rate {1,2,…,10}, not used in this exercise
constant=1 for all observations, not used in this exercise
wordlength=average word length
sqrtwords=square root of the number of words in the essay
commas= number of commas times 100 and divided by the number of words in the essay
errors=percentage of spelling errors in the essay
prepos=percentage of prepositions in the essay
sentlength= average length of sentences in the essay
grader2=1, if grader =2, 0 otherwise
grader3=1, if grader =3, 0 otherwise
grader4=1, if grader =4, 0 otherwise
grader5=1, if grader =5, 0 otherwise
ngrade=1 if grade (1,2), 2 if grade (3,4); 3 if grade (5,6} and 4 if grade (7,8,9,10}
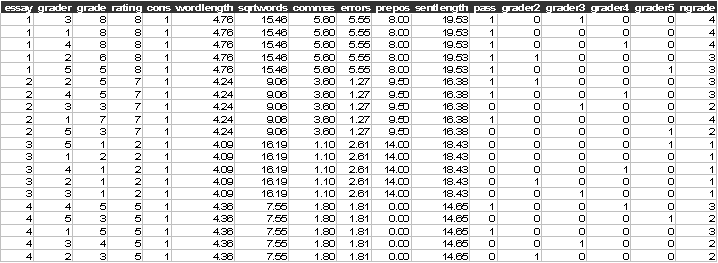
The first few lines of the data (essays_ordered.dat) look like:

Start Sabre and specify transcript file:
out essays_ordered.log
data essay grader grade rating
constant wordlength sqrtwords
commas errors &
prepos sentlength
pass grader2 grader3 grader4 grader5 ngrade
read essays_ordered.dat
Suggested exercise:
(2) Fit an ordered probit model to ngrade but without any random effects.
(3) Fit an ordered probit model allowing for the essay random effect, is the essay effect significant? How many quadrature points should we use to estimate this model?
(4) Add the dummy variables for graders (2,3,4,5) to the model, are there differences between the graders?
(5) Add the 6 essay characteristics to the previous model. Which of them are significant? Has including the essay characteristics improved the model?
(6) Create interaction effects between the grader specific dummy variables and the sqrtwords explanatory variable and add these effects to the model, What do the results tell you?
Repeat exercise components 2-6 treating grade as an ordered probit model with all the observed categories (1,2,…,8) of grade, grades (9,10) are not observed in this data set..
Are there any differences between the results obtained using the alternative ordered responses ngrade and grade? What does this tell you?
References
Johnson, V. E., and Albert, J. H., (1999), Ordinal Data
Modelling, Springer,
Rabe-Hesketh, S. and Skrondal, A., (2005), Multilevel and Longitudinal Modelling using Stata, Stata Press, Stata Corp, College Station, Texas